
Interactive 3-D render from simulation: a translucent blue envelope of compressed fuel holding nested violet, orange and white-gold shells, the hottest regions just above and below the centre along the collision axis.

“If thought corrupts language, language can also corrupt thought.”

George Orwell, Politics and the English Language, 1946

Impact-Initiated Fusion (IIF) · Melbourne, Australia

A tale of two projectiles and an eccentric Z-Pinch.

Two Rattler accelerators fire small fuel projectiles into each other at the heart of Helios, a pulsed-power Z-pinch. Collision and pinch are designed to focus their energy into a hot spot. The design has been worked out in simulation. Physical testing is underway.

Simulation: Fig. 1 · The hot spot at first stagnation · t = 2.5 ns

3-D view: drag to rotate. With the view focused, arrow keys turn it, plus and minus zoom, R resets and Space pauses rotation.

Hardware, written like software.

We’re set on changing the shape of how fusion is done.

Nobody has yet built a machine that makes more electricity than it draws from the wall. Our route there starts with simulation software that follows the whole collision in 3-D. Machine learning is built into the design loop. A committee of models, trained on our own simulations, proposes what to try next.

A design change becomes a new run before it becomes a new part. This leads to what we call fusion 2.0: machines as fluid as the code that designs them. We are betting on a world where hardware and software are one and the same.

How IIF works

Impact-Initiated Fusion uses the energy of a collision to start fusion. Four things have to come together.

  1. Very high impact speed
  2. Focusing of that energy into a small hot spot
  3. A magnetic field that slows heat loss
  4. High fuel density at the moment of collision
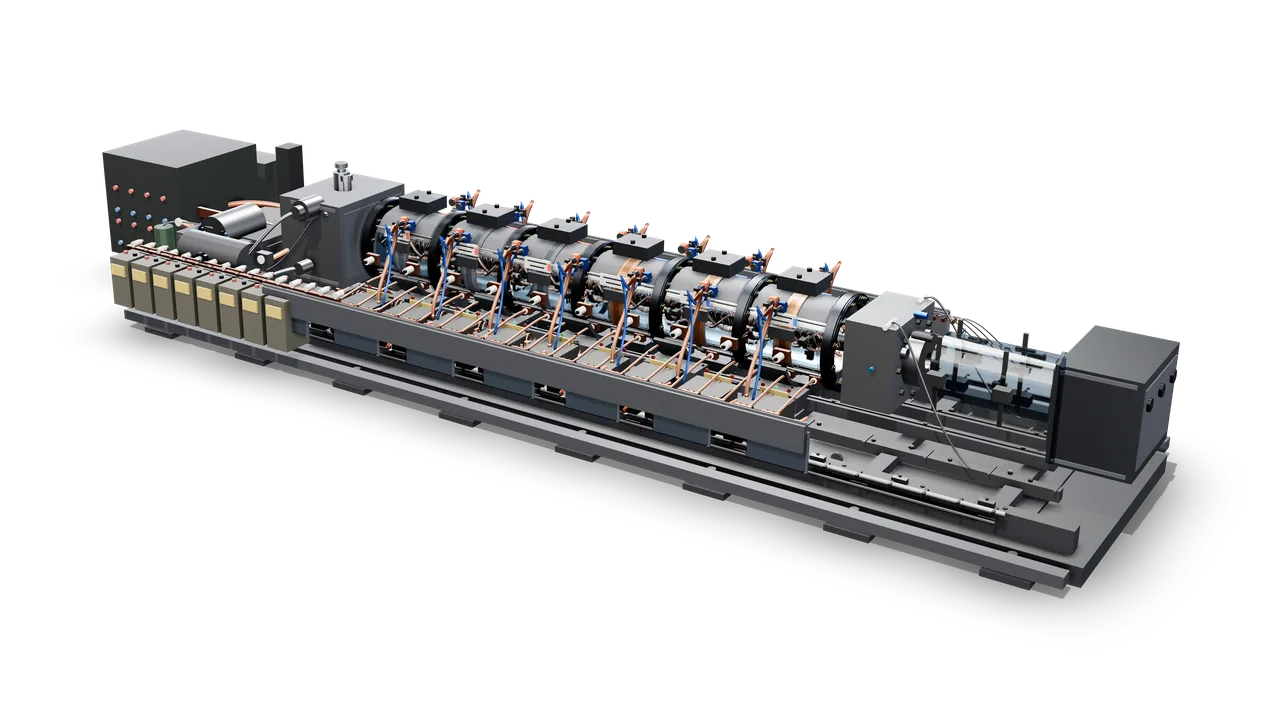
  1. Concept render of the Rattler electromagnetic accelerator on its own, cut out on a transparent background: the full machine from a raised three-quarter angle, from the power-electronics cabinet at the left to the glass muzzle section and steel end housing at the right, with six satin-steel barrel stages banded with copper along the grey skid.
    Concept art: Rattler electromagnetic accelerator
    01 / 03

    Accelerate

    Two Rattler electromagnetic accelerators fire small fuel projectiles at each other at very high speed. Getting both to arrive at the same point at the same instant, shot after shot, is half of the engineering.

    Electromagnetic accelerators
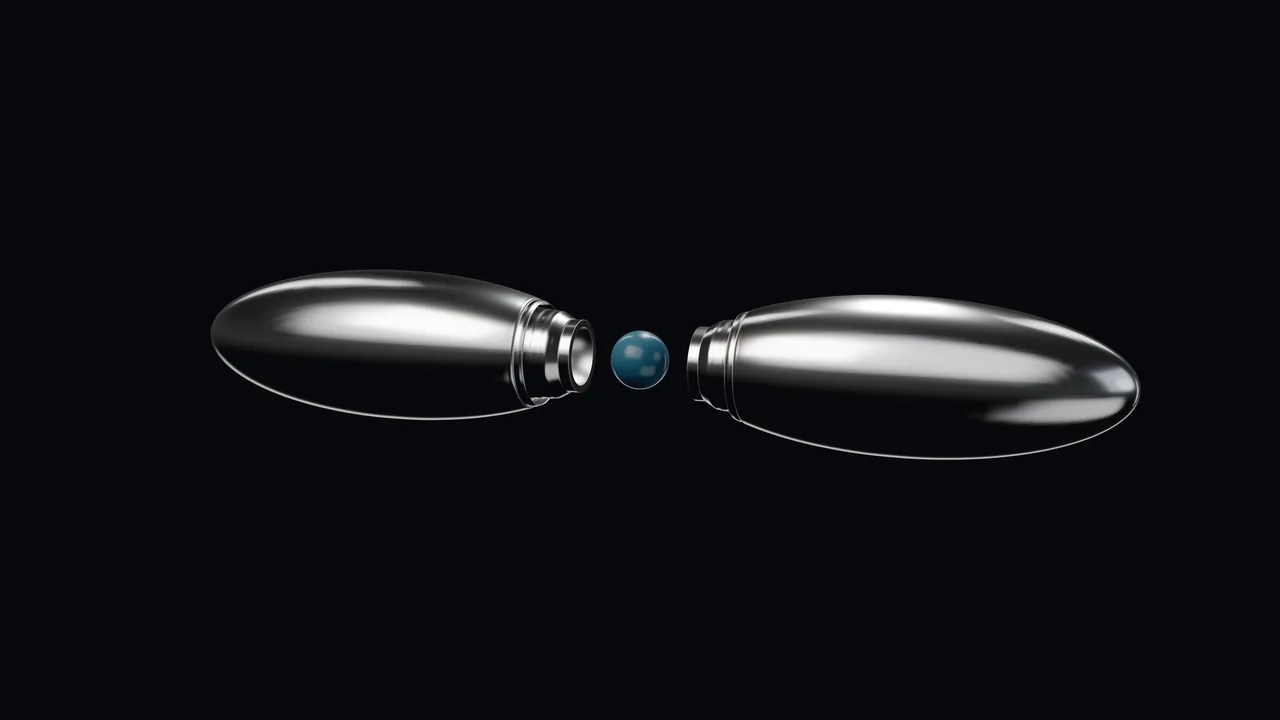
  2. Concept render of two mirrored projectiles closing along their shared axis on a small spherical capsule floating between them.
    Concept art: Two projectiles closing on the capsule until they lock
    02 / 03

    Collide

    The projectiles meet head-on and the impact drives shock waves inward. Their internal structure is designed to focus those shocks, the way a lens focuses light, onto a small central region.

    Shock lensing
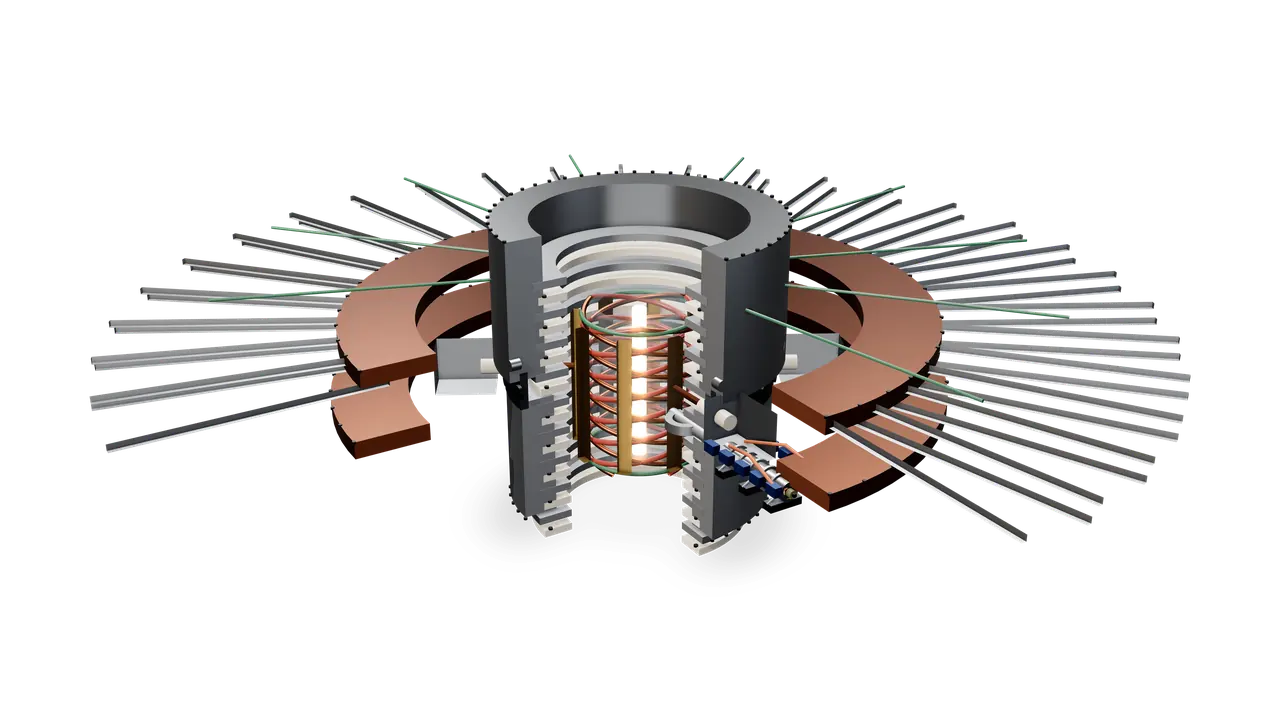
  3. Concept render of the Helios centre section with a quarter cut away: a ceramic and metal insulator stack around counter-wound helical coils, gold octupole pole shoes and a glowing orange Z-pinch column, with copper collector plates, radial transmission lines and a Rattler entering from the right.
    Concept art: Helios centre section, quarter cut-away
    03 / 03

    Pinch

    The collision happens at the heart of Helios, a pulsed-power Z-pinch. The fuel carries its own magnetic field, and Helios’s pulsed current is designed to pinch the hot spot, holding it together for longer and cutting heat loss. Neutrons from the reaction go to a lithium blanket, which makes heat for power and tritium for fuel.

    Magnetic pinch

Most of the ingredients have been shown to work elsewhere.

  • 2022

    National Ignition Facility

    Converging shock waves created the hot spot behind the National Ignition Facility’s 2022 ignition result.

  • Sandia

    MagLIF

    Sandia’s MagLIF program showed that fuel held in a magnetic field keeps its heat better.

  • Classic

    Magnetic pinch

    Magnetic pinches are one of the oldest tools in fusion.

  • 2021

    First Light

    In 2021, First Light used a projectile to initiate fusion.

What’s different

  1. 01

    Fuel on board.

    The projectiles carry the fuel. There is no separate target to make, place and hit for each shot.

  2. 02

    Energy in motion.

    Most of a laser’s input energy never reaches the fuel. A projectile brings its energy with it, which in principle is far more efficient.

  3. 03

    Three things invented.

    A projectile shaped to focus the collision’s shocks into a hot spot, two accelerators timed to meet exactly on every shot, and an eccentric Z-pinch that sparks the plasma.

Technology readiness1

Simulation software
TRL 6
Hardware
TRL 2

The simulation software, built on Gkeyll, is well past the concept stage: it models the collision in 3-D on GPU and CPU supercomputers and performs as designed. We cross-check its results against a second solver configuration. The hardware is at the concept stage.

Powered by MATLAB® and Simulink®. Ciral Fusion is a member of the MathWorks Accelerator Program.

Shock lenses

Every face a lens.

Between the two projectiles, the fuel sits at the centre of a faceted shell. Each face is shaped as a lens, designed to bend the collision’s shock toward the centre so the fuel is squeezed evenly from every side.

Whether the lenses even out the implosion is still an open question.

Concept art: Shock lens shell
Concept render of a closed, faceted sphere of many flat faces on a dark background, in an illustrative polished finish that mirrors the studio light, so some facets shine bright and others fall dark, with fine bright lines along their edges, lit from the upper left.
Concept art: Shock lens shell
Concept render of the faceted lens shell opened up: three facets are missing from one side, leaving an opening onto a smooth, softly lit blue sphere of fuel at the centre. Two neighbouring facets, one at the upper left of the opening and one at its right, are lifted a short way straight outwards; the rest of the shell is intact, in an illustrative polished finish.
Concept art: Lens shell opened to show the fuel
Concept render of the locked pair from a high three-quarter angle: the nearer projectile fills the lower right, the joint and the second projectile recede to the upper left.
Concept art: Ciral projectiles locked around the fuel capsule

Inside Rattler

A closer look at one of the two electromagnetic accelerators.

Close-up concept render of the Rattler breech: a gunmetal breech block with three round bosses and bolt heads on its end face and a valve on top, the first barrel stages receding up and to the right into soft focus, each crowned with copper connectors and blue fibre lines, with satin-metal capacitor cylinders along the lower edge.
Concept art: Rattler breech and first barrel stages

Inside Helios

Concept render of the Helios Z-machine facility from a low three-quarter angle: a ring of Marx generator banks, capacitor rows and pulse-forming lines with radial transmission lines converging on a sectioned centre, and a wedge cut away at the front.
Concept art: Helios Z-machine facility

Fired in software first.

Everything below is simulation output: computed, not measured. Physical testing is underway.

The whole collision, cell by cell.

Fuel, shock waves, magnetic field and burn, followed in three dimensions before anything is machined.

  • 19.4millioncells in the 3-D grid2, 208 × 208 × 448
  • 1,024parallel processes share the run2
  • 21full 3-D snapshots3, one every 0.5 ns to 10 ns
  • 2.5 and 5.5 nanoseconds.first and second stagnation3
  • 20 and 14 kiloelectronvolts.average hot-spot ion temperature4
  • 0.53 and 1.6 grams per cubic centimetre.average hot-spot density4
  • 0.37 and 0.18 nanoseconds.Confinement time superscript 2, one for each stagnation5
  • Radiation losses included.6

A hot spot you can turn in your hand.

Volumes show the hot spot as a 3-D object: nested surfaces, each enclosing hotter fuel than the one around it, at the two moments the fuel stagnates.

Interactive 3-D render from simulation: the hot spot at first stagnation, a translucent blue fuel envelope around nested violet, orange and white-gold surfaces of rising ion temperature.
Simulation: Fig. 2 · t = 2.5 ns · First stagnation · hot-spot ions average 20 keV, 0.53 g/cm³4 Nested surfaces of rising ion temperature inside the fuel boundary. Surfaces are smoothed for display; colours show relative values.
  • Fuel boundary
  • Hotter
  • Hotter still
  • Hottest

With the 3-D view focused, arrow keys turn it, plus and minus zoom, R resets and Space pauses rotation.

Simulation image: the compressed fuel at first stagnation cut in half along the collision axis, ion temperature on the left face and fusion burn rate on the right, inside a green outer fuel surface.
Simulation: Fig. 3 · t = 2.5 ns · hot-spot ions average 20 keV4 Surfaces smoothed for display; colour scales saturate at their ends.

Temperature on the left. Burn on the right.

Slices show what happens inside. We cut the fuel along the collision axis at first stagnation: one half shows how hot it is; the other shows where fusion reactions run fastest.

  • Ion temperature, cooler to hotter
  • Burn rate, slower to faster
  • Outer surface of the fuel
Simulation image: the ball of fuel cut in half down the collision axis, the left face glowing purple to bright yellow near the axis, the right face deep blue, wrapped in a green outer skin.
Simulation: Fig. 4 · t = 1.5 ns The fuel falling inward. Left face: flow speed (brighter is faster). Right face: density (paler is denser). Green: the outside of the fuel.
Simulation image: the fuel squeezed into a spinning-top shape and cut in half, orange and yellow regions on the left face, pale cyan to deep blue on the right, with a green outer skin.
Simulation: Fig. 5 · t = 2.5 ns First stagnation, cut along the collision axis: flow speed on the left face, density on the right.

Frame by frame.

The first 5.5 nanoseconds of the simulated shot, one frame every half-nanosecond. Times count from the start of the shot.

Simulation image: six snapshots from 0.5 to 3.0 ns. A faint sphere of fuel becomes a lens shape as burning regions grow along the vertical collision axis.
Simulation image: five snapshots from 3.5 to 5.5 ns. The fuel rebounds, then is squeezed again into a thin vertical column.
0.5 ns
Simulation: Fig. 6 · t = 0.5 to 5.5 ns Eleven snapshots, 0.5 ns apart. The fuel is squeezed, rebounds, and is squeezed again into a thin column along the collision axis.
Simulation image: the fuel at second stagnation laid on its side, a long thin column split along its length, flow speed above the axis and density below, edged in green.
Simulation: Fig. 7 · Second stagnation, 5.5 ns, laid on its side: flow speed above the axis, density below Swipe along the axis
Simulation image: nested surfaces of ion temperature inside the fuel, crimson and magenta folds with bright orange patches in a translucent green skin, crossed by a thin white frame.
Simulation: Fig. 8 · t = 2.5 ns Nested surfaces of equal ion temperature inside the fuel; colours step from purple through red to orange as temperature rises. The white frame marks the mid-plane where the projectiles meet.
Simulation image: glowing green filaments of magnetic-field strength arching above and below a thin white frame, inside a faint dark-blue shell.
Simulation: Fig. 9 · t = 2.5 ns The plasma’s own magnetic field: seeded at the start, generated in the plasma and amplified as it is compressed.

One state, solved two ways.

We took one saved state of the simulation, from shortly before the times shown, and carried it forward with two solver configurations. In the cavity at the heart of the collision, the overall shape agrees; the fine structure at its centre differs. Comparisons like this show which features depend on the solver configuration.

Simulation image: four cut-away views of the cavity at the heart of the collision, in two pairs. Each is a tall, waisted shape edged in green and split down the middle, with flow speed glowing purple to orange on the left face and density in blues on the right. Within each pair the outlines match; at the centre, configuration A shows a bright knot of fast flow while B is calmer.
Simulation: Fig. 10 · t = 7.5 and 8.0 ns The cavity, cut along its axis. Left face: flow speed (brighter is faster); each pair has its own flow-speed scale, wider at 8.0 ns, so compare flow speed within a pair, not between pairs. Right face: density (paler is denser), on one scale for all four. Green: the cavity wall, where the dense surrounding material begins, not the edge of the fuel.
  • Flow speed, slower to faster
  • Density, lower to higher
  • Cavity wall

Next-generation simulation, at supercomputer scale.

Our simulation software is built on Gkeyll, the open-source plasma-physics framework, and extended by Ciral for IIF. Tested on GPU and CPU supercomputers, the software is at TRL 6.1 It guides what we build, and physical testing will check it against reality.

Frontier Machine Learning Surrogates propose. Physics decides.

Machine learning searches the design space. The full solver has the final word. Every round, the surrogates rank thousands of candidate designs; only the best eight are flown in the full solver.

One design search, evaluation by evaluation80 candidate designs, each evaluated in the 3-D physics engine, plotted in order with their normalised scores. A step line traces the best score measured so far; it rises through the initial survey of 16 designs and the 8 committee-chosen rounds, reaching the best measured design at evaluation 73, in round 8.

One design search, evaluation by evaluation

Each dot is one candidate design flown in the 3-D physics engine; the line is the best measured so far.

The first 16 are an even survey; after that, the committee chooses.

SimulationScores are normalised so that no absolute performance value is shown.
The design-search loop A space-filling survey of candidate designs is run through the 3-D physics engine. The measured scores train a committee of surrogate models, which proposes the next round of designs. Each new best design is re-run on a finer grid, and every search ends with an honest verdict: target reached, plateau, or budget spent. 01 Survey A space-filling sample of the design space 02 Physics engine Every candidate is flown in the 3-D hydrocode 03 Surrogate committee Attention, recurrence and boosted trees learn the score 04 Propose Best guesses, plus the designs the models disagree on most scores next round, retrained on every result new best? 05 Confirm Each new best is re-run on a finer grid. The winner is always measured, never predicted. 06 Honest verdict Target reached · Plateau · Budget spent Surrogates propose. Physics decides.
The design-search loop A space-filling survey of candidate designs is run through the 3-D physics engine. The measured scores train a committee of surrogate models, which proposes the next round of designs. Each new best design is re-run on a finer grid, and every search ends with an honest verdict: target reached, plateau, or budget spent. 01 Survey A space-filling sample of the design space 02 Physics engine Every candidate is flown in the 3-D hydrocode scores 03 Surrogate committee Attention, recurrence and boosted trees learn the score 04 Propose Best guesses, plus the designs the models disagree on most next round, retrained on every result new best? 05 Confirm Each new best is re-run on a finer grid. The winner is always measured, never predicted. 06 Honest verdict Target reached · Plateau · Budget spent
SchematicThe design loop. The models propose, the physics simulation decides, and every search ends with an honest verdict.

Every projectile design has many interacting dimensions, and each full simulation is expensive. So we train fast surrogate models on the simulations we have already run, and let them suggest what to try next.

Three different model families vote: a Transformer, a deep LSTM and a gradient-boosted tree ensemble. Where they disagree, the search looks harder. Every promising candidate is re-run on the full physics solver, at higher resolution, before it counts.

  1. A committee, not an oracle.

    Three model families, trained separately, vote on every candidate design.

  2. Disagreement is a signal.

    Where the models disagree, the next simulations go.

  3. The solver decides.

    Nothing is a result until the full simulation confirms it on a finer grid.

A committee of three model families Three different kinds of model learn the same score from the same measured designs: a transformer that treats each design parameter as a token and uses self-attention, a deep LSTM that reads the parameters as a sequence through two stacked recurrent layers, and an ensemble of gradient-boosted trees. Their average is the prediction; their disagreement is the uncertainty. The proposal score is the prediction plus a multiple of the uncertainty, and the top-scoring designs are flown in the physics engine. Attention Transformer Each design parameter becomes a token; self-attention learns how they interact. Recurrence Deep LSTM Parameters are read as a sequence through two stacked recurrent layers. + + + … Trees Boosted trees 120 shallow trees, each one correcting the errors of the last. Prediction the average of all nine models Uncertainty how much the nine models disagree Proposal score thousands of candidates ranked per round; the top eight go to the physics engine Proposal score = prediction + k × uncertainty
SchematicThree ways of seeing one problem. The committee’s average is its prediction, and its disagreement is its uncertainty.

Predicted before it was simulated

For every proposal, the committee’s prediction (made using only earlier results) against what the physics engine then measured.

  • Search A (temperature + energy delivery)
  • Search B (second architecture)
  • Search C (adds a radiation-loss term)
  • Diagonal: prediction equals result
SimulationRetrospectiveRetrospective test on archived simulation results. The committee ranks designs well but not perfectly; on average its misses were larger where it reported more uncertainty, but some large misses came with no warning, which is why the physics engine has the final word.7
Predicted before it was simulatedScatter plot of the committee's normalised prediction against the physics engine's normalised result for every proposal in three searches, with the line where prediction equals result. Most points sit near the line; a few fall well below it.

Seven searches, seven honest verdicts

Archived design searches run with the Digital Twin’s physics engine in the loop.

Seven searches, seven honest verdicts
SearchDesign spaceSurrogateDesign parametersEvaluationsRounds after surveyVerdict
Search 1Lens geometryDeep ensemble (5 neural networks)9202Fixed budget (2 rounds)
Search 2Lattice micro-structureDeep ensemble (5 neural networks)12727Plateau
Search 3Architecture variant 1Deep ensemble (5 neural networks)12403Plateau
Search 4Architecture variant 2Committee (9 models, 3 families)13808Budget spent (still improving)
Search 5Variant 2 + radiation-loss termCommittee (9 models, 3 families)13727Plateau
Search 6Variant 2 + radiation-loss term (paired test)Deep ensemble (5 neural networks)13403Plateau
Search 7Architecture variant 3Committee (9 models, 3 families)14808Plateau
7 searches · 404 evaluations
SimulationCounts only; no design values or performance numbers.

Measured, not predicted.

The models are written in-house and gradient-checked. The search reports what the solver measured, not what a surrogate predicted.

The books balance on every run

Energy-conservation residual of every archived physics-engine evaluation used by the design searches.

The books balance on every runHistogram of the relative energy-ledger residual for 404 archived physics-engine evaluations, on a logarithmic axis. Every evaluation falls between one part in ten trillion and one part in a trillion.
SimulationSimulation bookkeeping check: energy in = energy out, to numerical precision.
Simulation image: false-colour map of a bright vertical column of hot plasma at the collision focus, with thin density contour lines curving around it.
Simulation: Fig. 11 Simulated focal region of a design proposed by the search: temperature in false colour, with density contours.

Three physical tests, cheapest first

Each test has to pass before the next one is funded. The design has been worked out in simulation, and Phase A is underway.

  1. Phase AUnderway

    The implosion test

    Our first implosion runs, on existing test facilities. They show whether the model predicts how a real projectile behaves on impact. No fusion fuel is involved yet.

    ~12 months

    Real impact behaviour compared with the model

  2. Phase B

    The accelerator

    A bench-scale electromagnetic accelerator. We measure how much energy it puts into a projectile and how efficiently, then time two arms to meet.

    ~2 years from funding

    Projectile energy and driver efficiency measured

  3. Phase C

    The hot spot

    Both arms fire into a collision chamber. We look for fusion neutrons, and for evidence that they come from a hot spot rather than a few stray fast particles.

    ~3 years from funding

    Fusion neutrons from a shaped collision

  4. After C

    Gain, then a pilot plant

    The next experiment uses deuterium-tritium fuel and aims for scientific gain: more fusion energy out of the fuel than goes into it. A pilot plant that makes electricity comes after that.

    Funded by the next raise

    Scientific gain with deuterium-tritium fuel

Concept render of the Rattler in a long side elevation: the power-electronics cabinet at the far left, standing clear of the end of the skid, then the capacitor modules, the breech block, six barrel stages in a row and the transparent muzzle section with its steel end housing at the right, above a low grey skid.
Concept art: Rattler electromagnetic accelerator, side elevation
Jax El Antaki

The person behind Ciral

Jax El AntakiFounder

Jax invented Ciral’s approach and built the simulation engine behind it, which we call the Digital Twin. His background is in mathematical physics and machine learning, and he uses both to model the plasma and try designs in software long before anything is built.

LinkedIn

Get in touch

We’re raising now, in stages tied to the tests above. We’d like to hear from investors, research groups, government partners and data-centre operators planning for firm power in the 2030s.

Melbourne, Australia